Financial-Statements-in-power-bi
Project Overview
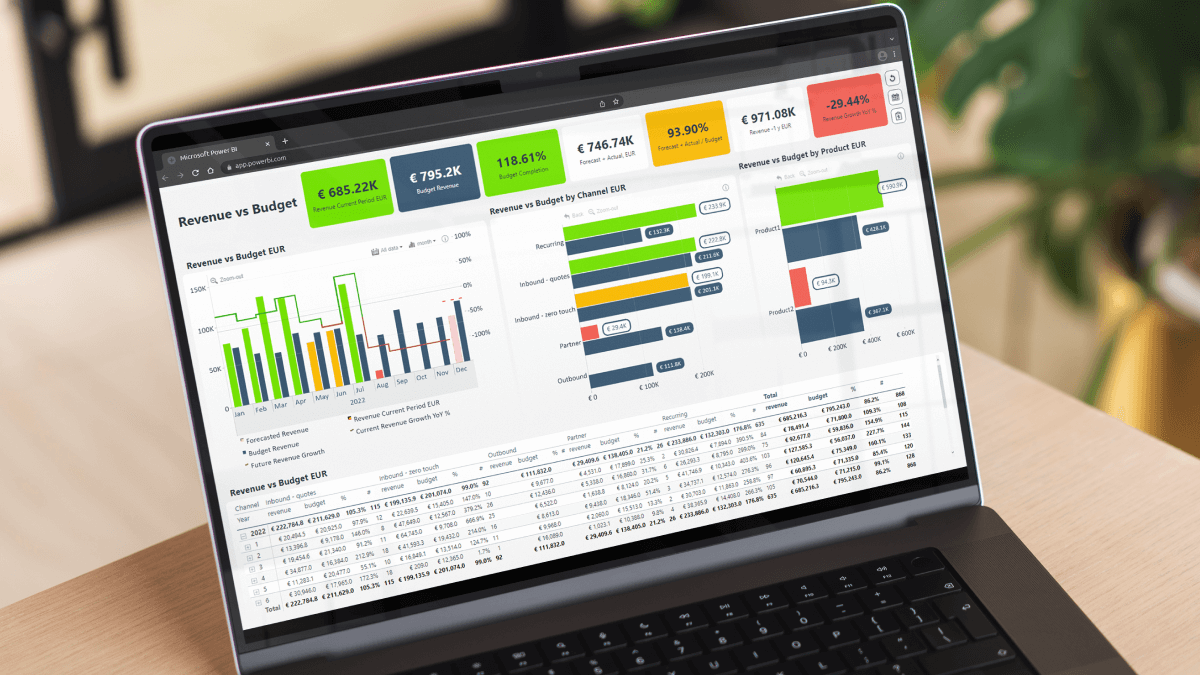
Financial data is at the heart of business decision-making, yet static and manual reporting processes often hinder timely and accurate analysis. Analyzing financial data effectively is critical for organizations to understand their performance and make informed decisions. Traditional financial statements often lack flexibility and interactivity, limiting their usability for dynamic reporting. This project addresses these challenges by utilizing Power BI to create a comprehensive and interactive financial statement dashboard. By combining SQL for data extraction and transformation with Power BI’s visualization tools, this solution aims to enable businesses track critical metrics like revenue, expenses, and profitability in real time, fostering better insights and more agile decision-making.
Problem Statement
Gl Retail Inc currently relies on manual processes to analyze financial statements, which is time-consuming and potentially error-prone. Finance teams need to regularly track key metrics including Gross Profit %, EBIT %, Net Income %, and the Current Ratio between Current Assets and Current Liabilities. The challenge is to automate this process by developing a Power BI dashboard that directly connects to the company database, providing real-time financial analysis and trend visualization to support faster, more accurate decision-making.
Data Sources
The financial statement analysis draws from the following primary data sources:
- SQL Database:
Contains detailed transaction records and account balances GL Retail Server maintained by CFI
FactGLTran: Contains transaction records
GL Accounts: Chart of accounts and categorization

Stores: Store-level information

Region: Geographical segmentation data
Queried financial data FactGLTran, GL Accounts, Stores, and Region Tables.
Supporting Data
- Headers Table: Custom Excel table for financial statement structuring. View here
-
Date Dimension: Generated using Power Query for time intelligence. View here
### ETL (Extract, Transform, Load) Process
Used SQL queries to retrieve all financial data directly from the centralized database from FactGLTran, GL Accounts, Stores, and Region tables. Created dedicated SQL view to simplify data retrieval and improve query efficiency. The SQL querry used to retrieve the data and create sql view as a staging . View SQL Code Referenced the SQL view to create tables in Power Query Editor. Standardized column names and ensured consistent formatting for smooth integration into the Power BI model.
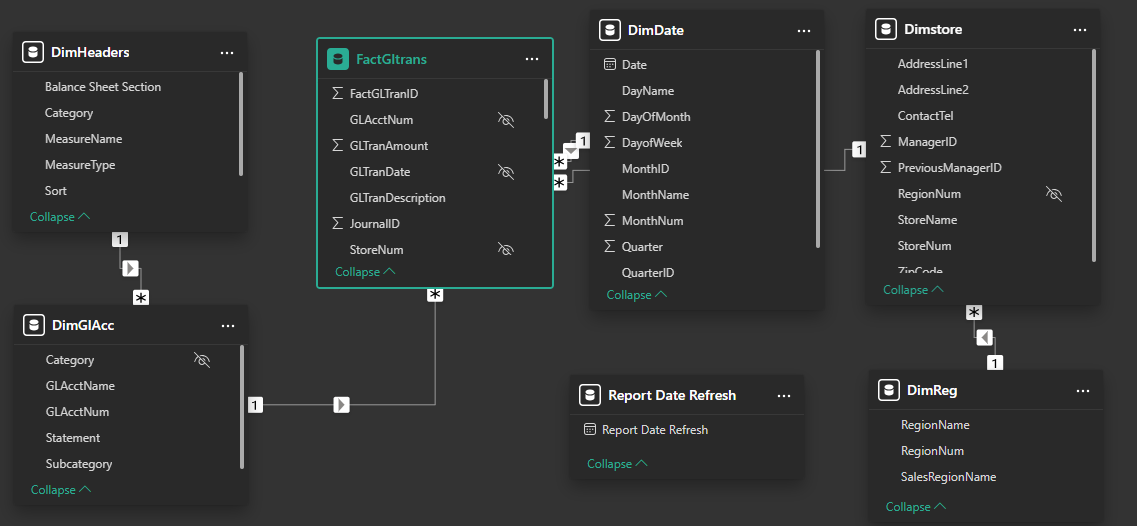
Data modelling
Created the Fact and Dimension Queries by referencing the Staging Query Added headers and date dimension tables. Established relationships between tables.
DAX (Data Analysis Expressions) Implementation
Our Power BI solution leverages sophisticated DAX measures to create dynamic financial calculations that adapt to different reporting contexts. Two key measures form the backbone of our financial reporting system
```Income statement =
 VAR DISPLAY_FILTER = NOT ISFILTERED(DimGlAcc[Subcategory])
RETURN
SWITCH(TRUE(),
SELECTEDVALUE(DimHeaders[MeasureName]) ="Subtotal" && DISPLAY_FILTER, [I/S Subtotal],
SELECTEDVALUE(DimHeaders[MeasureName]) = "Per_Of_Revenue"&& DISPLAY_FILTER,  [% Of Revenue],
[I/S Amount]
)```
That dynamically calculates and determine what kind of financial data to display in each row of the income statement based on the measure name.
```Balance Sheet =
VAR Display_filter = NOT ISFILTERED(DimGlAcc[Subcategory])
RETURN
SWITCH(TRUE(),
SELECTEDVALUE(DimHeaders[MeasureName]) = "Section_Subtotal" && Display_filter,[B/s Subtotal],
SELECTEDVALUE(DimHeaders[MeasureName]) = "Retained_earnings" && Display_filter,[Retained earnings],
SELECTEDVALUE(DimHeaders[MeasureName]) = "Total_Equity" && Display_filter,[Total Equity],
SELECTEDVALUE(DimHeaders[MeasureName]) = "Total_LE" && Display_filter,[Total Liabilities & Equity],
[Cumulative Amount])```
That dynamically calculates and determine what kind of financial data to display in each row of the Balance sheet based on the measure name.
Data analysis
The Income statement
Detailed Financial Reporting
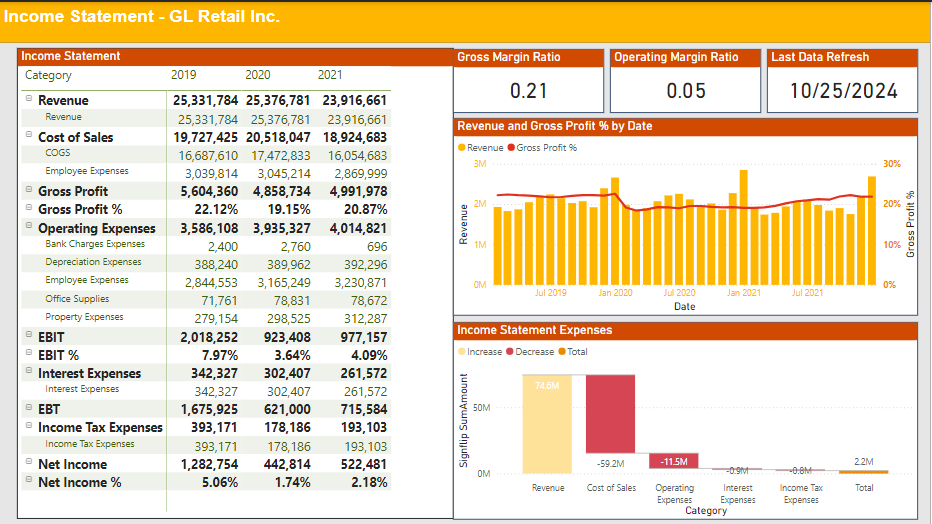
The analysis focused on the Income Statement to provide a clear picture of the organization’s profitability and operational efficiency. Key insights and visualizations developed to highlight financial performance and trends.
Key Analysis Areas
Detailed Financial Reporting
Used a matrix visualization to display the complete income statement, providing a detailed, structured breakdown of revenues, expenses, and profits.Highlighting key performance indicators like Gross Profit, EBIT, Net Income.
Revenue and Profitability Trends Analyzed revenue trends over time using a column and line chart combination to visualize revenue alongside the operating margin ratio.
Expense and Revenue Breakdown
Used waterfall chart to visually represent the flow of revenue and expenses leading to the final net income allowing users to easily see how different elements affect profitability.
Key Ratios and Margins
Displayed critical metrics such as the gross margin ratio and operating margin ratio using card visuals. These cards offer a quick summary of the company’s financial health and operational efficiency.
Balance Sheet
Detailed Breakdown:
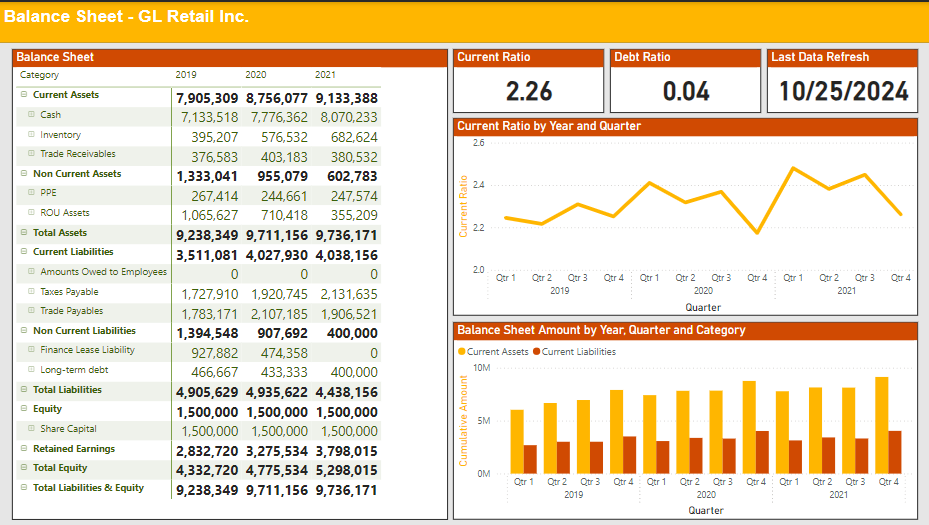
Breakdown of the balance sheet into key sections, including current and non-current assets, liabilities, and equity. The matrix visualization provides a comprehensive breakdown of key balance sheet components, including assets (current and non-current), liabilities (current and long-term), and equity. This structure ensures stakeholders can identify and analyze significant financial positions effectively.
Liquidity Trends:
Using the current ratio, to monitor the company’s ability to cover its short-term obligations over time.
Visualized through a line chart by year and quarter.
Current Assets vs. Current Liabilities:
Compare and track these components over time with a column chart segmented by year and quarter.
Debt Utilization:
Assess reliance on debt financing using the debt ratio card.
Conclusions and recommendations
This Power BI financial dashboard project has successfully transformed GL Retail Inc.’s static financial data into an interactive, dynamic reporting system. By leveraging Power BI’s visualization capabilities, I have created a comprehensive financial reporting solution that provides real-time insights into the company’s performance through intuitive charts, graphs, and KPI indicators. The dashboard effectively consolidates income statements, balance sheets, and key financial ratios, enabling stakeholders to drill down into specific metrics and track historical trends with ease. The visualization design emphasizes critical financial metrics through:
Color-coded waterfall charts showing income statement breakdowns
Trend analysis for margin ratios and revenue patterns
Interactive time-series comparisons across fiscal periods
Automated ratio calculations and performance indicators
Clear presentation of balance sheet components
Through analysis of GL Retail Inc.’s financial performance from 2019 to 2021, the dashboard reveals several significant trends and opportunities. The company has maintained strong liquidity with a healthy current ratio averaging above 2.0, indicating solid ability to meet short-term obligations. However, profitability metrics show concerning patterns, with operating margin declining notably from 7.97% in 2019 to 4.09% in 2021, primarily driven by increased operating expenses and reduced revenue. The business demonstrates conservative debt management, maintaining a low debt ratio around 0.04, which suggests untapped potential for strategic leverage. Revenue has experienced a gradual decline from $25.3M in 2019 to $23.9M in 2021, while costs have remained relatively high, particularly in employee expenses and operating costs. Cash management appears conservative, with substantial cash holdings consistently above $7M.
Key areas requiring immediate attention include:
Declining operating margins.
Downward revenue trend.
Rising operating expenses.
High cash holdings with potential for better utilization.
Cost of sales management.
The Power BI implementation has enhanced financial visibility and decision-making capability, allowing stakeholders to identify these trends quickly and monitor the impact of strategic initiatives in real-time. This transformed reporting system provides the foundation for more informed and timely business decisions, supporting GL Retail Inc.’s future growth and performance improvement efforts.